A Combined Cohort Study to Predict COVID-19 Recovery Time and Identify Risk Factors for Prolonged Recovery
By Alex McCreight, Jixin Li, Yueyi Xu
March 31, 2024
Introduction
The severe acute respiratory syndrome coronavirus 2 (SARS-CoV-2) was first identified in China in December 2019. Since then, the COVID-19 pandemic has posed a significant public health threat, particularly affecting older adults and individuals with chronic health conditions. Factors such as age, gender, vaccination status, the severity of COVID-19 symptoms, and pre-existing chronic illnesses play a crucial role in determining the recovery time for patients1.
In this project, we fit various models based on factors that potentially affect COVID-19 recovery time. First, we examine the data and visualize the relationship between risk factors and recovery time, as well as analyzing the correlation between factors. We then use different subsets of predictors to train and fit various types of models, including LASSO, elastic net, ridge regression, partial least squares, and MARS. Finally, we evaluate each model’s test error to make our final model selection.
Exploratory analysis and data visualization
With the goals of developing a prediction model for COVID-19 recovery time and identifying important risk factors for long recovery in mind, we first ran an exploratory analysis of all variables in our data set to visualize their relationship with recovery time. Our findings revealed that recovery time has a small positive correlation with age and weight, and a slightly stronger positive association with BMI. Conversely, height has a small negative relationship with recovery time.
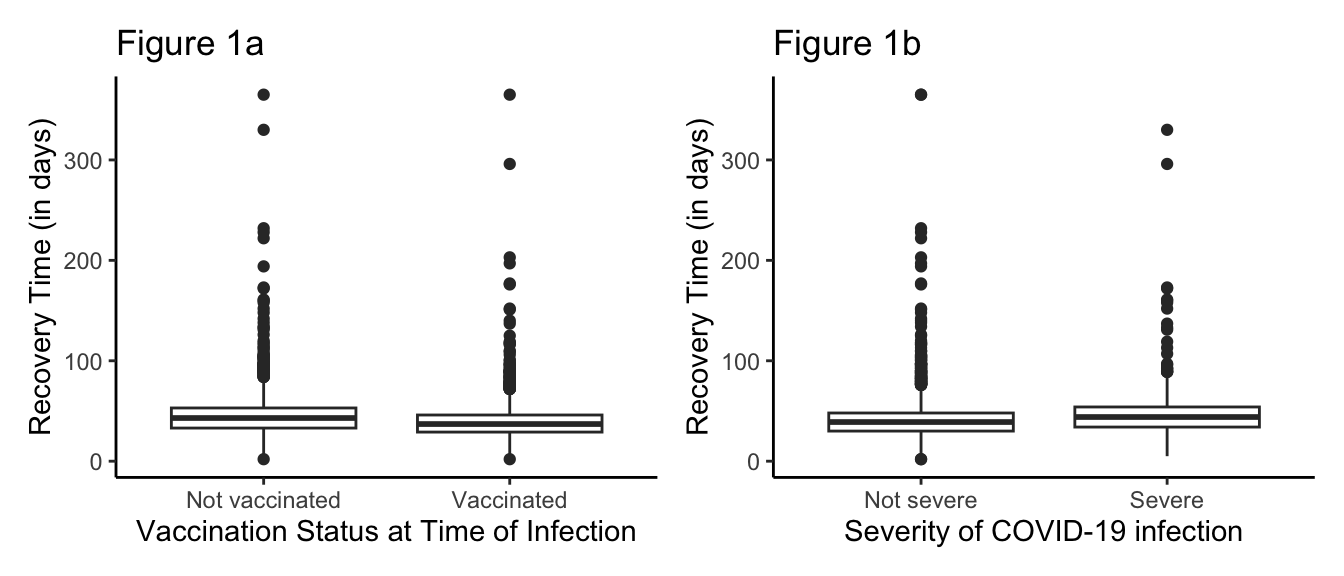
Among the discrete variables, we observed substantial differences in recovery time based on vaccination status as well as COVID-19 severity. Individuals who received the COVID-19 vaccine had shorter recovery times, on average, compared to those who have not received the vaccine (Figure 1a). Additionally, those with “severe” COVID-19 had longer recovery times, on average, compared to those with “non-severe” COVID-19 (Figure 1b).
Interestingly, we found that those with diabetes had a shorter average time to recovery compared to those without diabetes, which immediately seems counter intuitive (Figure 2). However, upon further literature review, we posit that those with diabetes in these studies either died more quickly compared to those without diabetes, or those with long-COVID and lived most likely had well-managed diabetes and took extra precautions against COVID-19 compared to those without diabetes2.
Finally, we observed a significant difference in the variability of recovery times of participants in study A versus study B. The exact reasons for this discrepancy are unclear, however, we hypothesize that study A was conducted when the vaccines were more available leading to reduced variability in recovery time compared to study B.

Model training
We used several methods to predict the time to recovery from COVID-19 including:
-
Least Absolute Shrinkage and Selection Operator (LASSO)
-
Elastic Net
-
Ridge Regression
-
Partial Least Squares (PLS)
-
Multivariate Adaptive Regression Splines (MARS)
LASSO, Elastic Net, Ridge Regression, and PLS all assume a linear relationship between the covariates/components and the outcome. Additionally, LASSO, Elastic Net, and Ridge regression all assume that the observations are all independent of each other and that the error terms are normally distributed with constant variance. These three model types all deal with multicollinearity slightly differently. Ridge regression tends to shrink highly correlated predictors towards each other, LASSO is relatively indifferent with highly correlated predictors and will just pick one and ignore the rest, and Elastic Net the most effective of the three to deal with groups of highly correlated predictors. PLS also handles multicollinearity relatively well. Finally, MARS is a non-parameteric technique that does not make explicit assumptions about the functional relationship between the predictors and the outcome. MARS is also unique among these other methods as it will automatically consider interactions between the predictors. While the MARS algorithm itself is assumption-free, the simulation studies used to evaluate its performance all assumed independent predictors and normally distributed error terms with mean 0 and constant variance3.
To obtain our final model, we considered two subsets of predictors. The first set contained all predictors available in the dataset, while the second set included a selected group of predictors that demonstrated a relatively strong association with recovery time during the exploratory analysis stage. These predictors were height, weight, vaccine, severity, and study. For each subset of predictors, we divided the data into training and testing sets using an 80%/20% split. This split allowed us to evaluate the performance of the models on unseen data and assess the generalizability of our model. An essential preprocessing step was the standardization of predictors, especially for models like LASSO, Elastic Net, and Ridge regression. Standardization involves scaling the predictors to have zero mean and unit variance, ensuring that the regularization penalty is applied uniformly across all predictors. This step is crucial for models that include regularization to prevent the magnitude of coefficients from influencing which predictors are selected or shrunk towards zero
We then used the caret package in R to train and tune the models. Specifically, we used the train function, where we tune the hyperparameters using a grid search. For each model type, we defined a grid of hyperparameter values and performed repeated 10-fold cross-validation five times to find the hyperparameter (or combination of hyperparameters) that yielded the lowest RMSE value (except for our LASSO model where we used the 1SE rule). For model comparison, we used test RMSE to select our model that best predicts COVID-19 recovery time.
Results
The testing RMSE results are shown in Table 1. The MARS model fit on the subset of predictors achieved the lowest testing RMSE of 17.773, indicating that it had the best predictive performance of COVID-19 recovery times out of all our models. We found that our MARS model with all predictors included in the data set had the second best predictive performance with an RMSE of 17.907. Interestingly, all of our LASSO, Ridge Regression, Elastic Net, and Partial Least Squares models all performed better using all predictors as opposed to a subset of predictors.
| Model | RMSE |
|---|---|
| MARS (Subset) | 17.773 |
| MARS | 17.907 |
| PLS | 18.383 |
| Elastic Net | 18.408 |
| LASSO | 19.068 |
| Ridge | 19.833 |
| Ridge (Subset) | 20.413 |
| Elastic Net (Subset) | 20.413 |
| PLS (Subset) | 20.437 |
| LASSO (Subset) | 20.828 |
Table 1: Comparison of RMSE values for different models
We note here some of the interesting coefficient results from the final model, Table 2. For individuals less than 159.6 cm tall, we expect to see a 10.103-day increase in the recovery time for COVID-19 for each centimeter decrease in height below 159.6cm, while holding all other variables constant. Additionally, for individuals in study A, with height less than 159.6 cm, and weight greater than 81.3 kg, we expect to see a 5.892 decrease in the number of days it takes to recover from COVID-19 compared to individuals with the same height and weight but in study B, while holding all other variables constant. For individuals who weigh more than 77.8 kg, we expect to see a 1.08 day increase in the recovery time for COVID-19 for each kilogram increase in the weight above 77.8kg, while holding all other variables constant. We expect to see individuals who received the vaccine to have a 6.581 day decrease in the recovery time compared to those who did not receive the vaccine, while holding all other variables constant. Finally, for individuals with severe COVID-19, we expect to see a 7.48 increase in the number of days it takes to recover compared to those who do not have severe COVID-19, while holding all other variables constant.
| Variable | Coefficients |
|---|---|
| (Intercept) | 36.542 |
| h(159.6-height) | 10.103 |
h(159.6-height) * h(weight-81.3) |
6.271 |
h(159.6-height) *h(weight-81.3)* studyA |
-5.892 |
| h(weight-77.8) | 1.080 |
h(171.7-height) * h(weight-77.8) |
0.533 |
| vaccine1 | -6.581 |
h(171.6-height) *h(weight-77.8)* studyA |
-0.405 |
| severity1 | 7.480 |
h(height-159.6) * h(87.3-weight) |
0.075 |
h(159.6-height) * studyA |
-6.236 |
Table 2: Coefficients results for MARS model
Conclusions
The study aimed to predict COVID-19 recovery time using various statistical models and factors such as age, gender, height, weight, vaccination status, severity of symptoms, and pre-existing chronic illnesses. After trying out different models including LASSO, Ridge, Elastic Net, PLS, and MARS, our analysis revealed that the Multivariate Adaptive Regression Splines (MARS) model performed the best, achieving the lowest RMSE and demonstrating good predictive performance. Factors such as height, weight, vaccination, and severity were found to significantly influence COVID-19 patients’ recovery time. Specifically, for individuals shorter than 159.6cm, a decrease in height, and for individuals heavier than 77.8kg, an increase in weight, led to longer recovery times. While vaccination and less severe symptoms were associated with shorter recovery times. These findings highlight the importance of considering individual characteristics and health status when predicting COVID-19 outcomes and designing targeted interventions for patient care and management.
Additional Considerations
In our analysis, we chose to include the ‘study’ variable in all of our models to both enhance their accuracy and improve interpretability. During the exploratory analysis stage, we observed significant differences in recovery times between individuals from Study A and Study B. However, lacking detailed contextual information, we can only hypothesize the factors driving these differences. By adjusting for the ‘study’ variable, our models effectively account for various unmeasured factors that could influence recovery times, such as the period during which the study was conducted, the characteristics of the study population, and the type of care received. This adjustment not only enhances the models’ predictive power but also ensures that the coefficients of other variables more accurately reflect their independent associations with recovery time.
References
1. Al-Thaqafy MS BR Batahaf R. Factors affecting confirmed COVID-19 patient’s recovery time at king abdulaziz medical city, jeddah [Internet]. 2023. Available from: https://www.ncbi.nlm.nih.gov/pmc/articles/PMC9947720/
2. How coronavirus impacts people with diabetes [Internet]. American Diabetes Association; Available from: https://diabetes.org/getting-sick-with-diabetes/coronavirus-covid-19/how-coronavirus-impacts-people-with-diabetes
3. Friedman JH. Multivariate Adaptive Regression Splines. The Annals of Statistics [Internet]. 1991;19. Available from: https://doi.org/10.1214/aos/1176347963
- Posted on:
- March 31, 2024
- Length:
- 8 minute read, 1586 words
- See Also: